The Canary Reactor: How TheProtocol Watches Itself, One Real Transfer at a Time
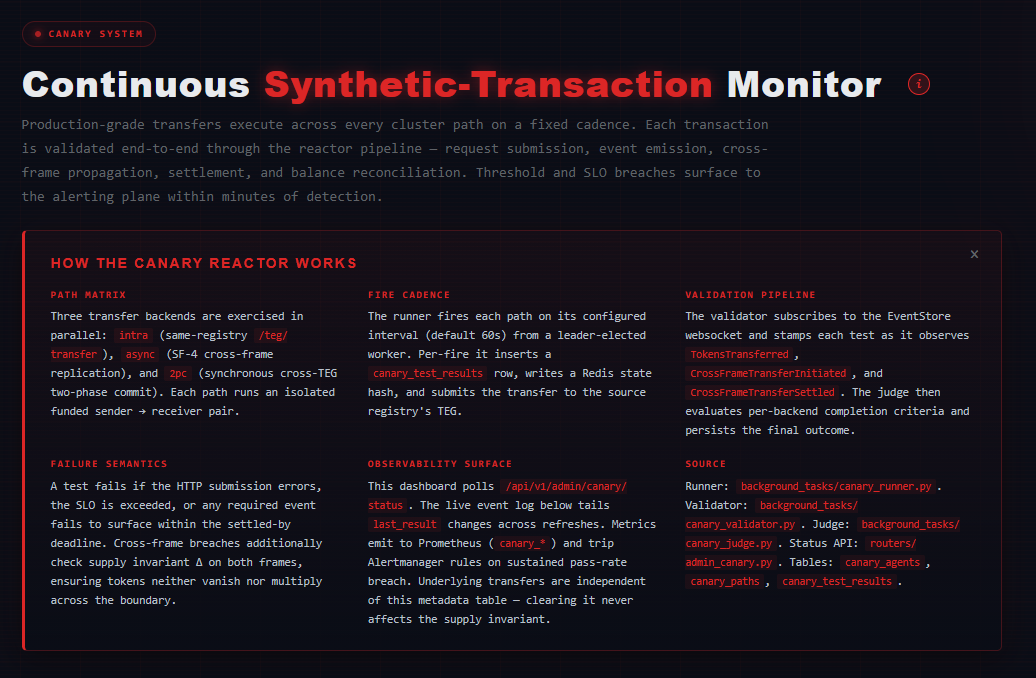
/ui#/admin/canaries with the (i) panel open. One paragraph that took longer to write than it looks, sitting on top of a system that fires real transfers every sixty seconds across every path that matters — and inline architecture context one click away.Most synthetic monitors are a polite fiction. A scheduled job hits a health endpoint, the endpoint returns 200, the dashboard turns green. What that actually proves is that one HTTP handler returned bytes. It does not prove that the database accepted a write, that an event was published, that downstream reactors processed it, that the receiver’s balance moved, or that any of the things you care about in production actually happened.
The canary reactor is the opposite of that. It moves real AVT between funded canary agents on real production infrastructure, watches the resulting events propagate through five reactors and the EventStore, and tells you exactly which phase silently broke when something silently breaks. It runs continuously. It uses the same code paths as user traffic. There is no test harness.
What it actually does
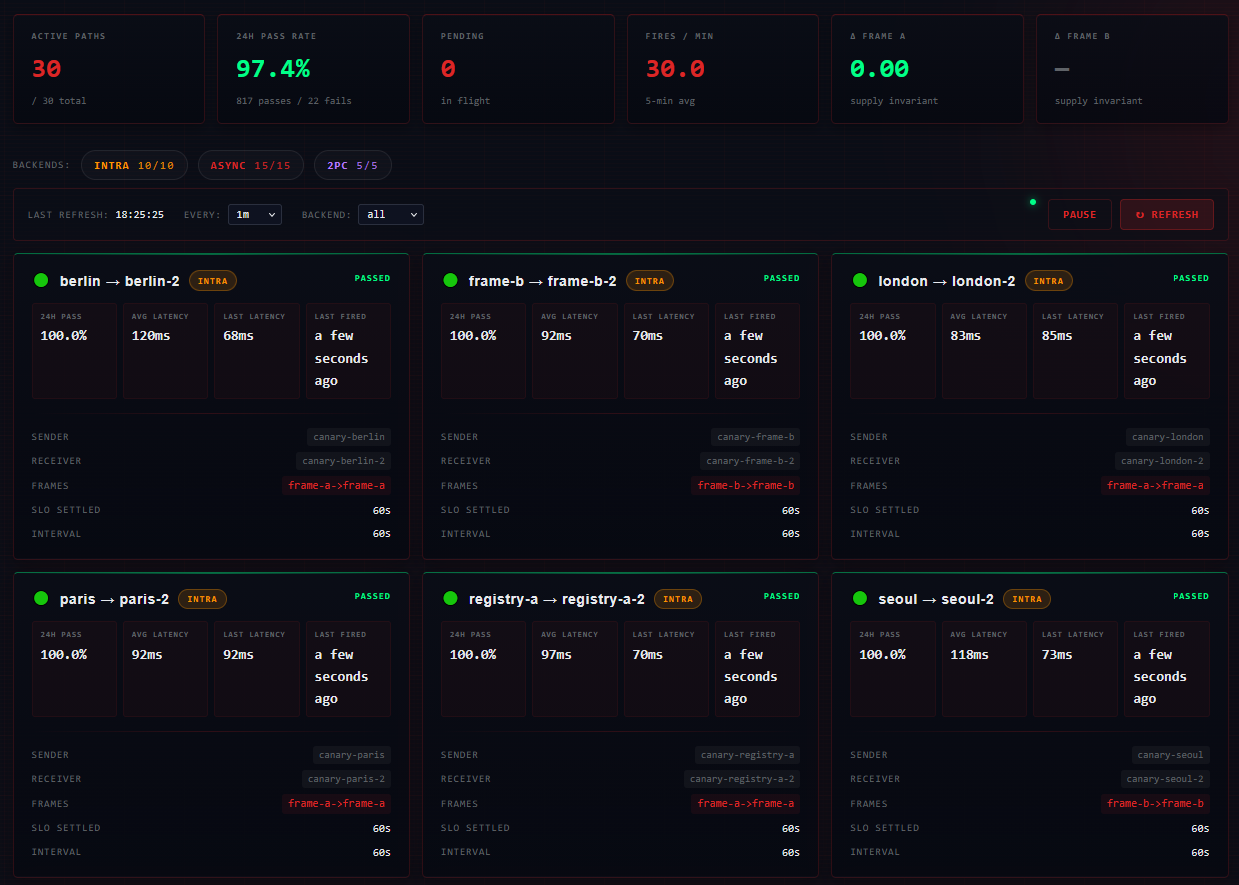
Thirty paths, thirty senders, thirty receivers. Every sixty seconds a leader-elected runner on registry-a reads the active rows from canary_paths, picks up a JWT for each canary agent, and submits a real transfer to that agent’s home registry. Three backends are exercised in parallel:
intra— same-registry/teg/transfer. Sender and receiver live on the same TEG layer; the test exercises the local fee path, the EventStore append, and the per-row balance update. EmitsTokensTransferred+TransactionFeeCollected.async— cross-frame via the SF-4 replicator. Sender frame emitsTokensTransferred+CrossFrameTransferInitiated+TransactionFeeCollectedand returns 200 immediately. The replicator broadcastsInitiatedto the peer frame’s WebSocket subscribers, the receiver-frame reactor credits via its own TEG and emitsCrossFrameTransferSettled, which SF-4 fans back to the sender frame. The unhappy path isCrossFrameTransferRefundedvia the saga sweeper.2pc— synchronous two-phase commit between TEGs. Source TEG holds a prepare lock, target TEG accepts via mTLS, source commits or refunds. Always emitsTokensTransferred+CrossRegistryTransferCompleted+TransactionFeeCollected(the canonical 2pc completion event isCrossRegistryTransferCompleted, not anything cross-frame-shaped). Cross-frame 2pc additionally emits one extraCrossFrameTransferSettled— not because the protocol needs it, but because SF-4 broadcasts that event type and nothing else, so without that one extra emit the canary on the other frame would never see the transfer land.
Every fire pre-creates a canary:<test_id> hash in Redis before the HTTP call. This matters because the validator subscribes to the EventStore WebSocket, and on a fast cluster the first event lands inside fifty milliseconds — well before the runner could otherwise stamp the correlation index. Pre-creation closes that race; the test_id is a key that exists by the time anything looks for it.
Five reactors watching the EventStore
The validator is not one process. It’s five separate reactors, each subscribed to one event type, each leader-elected via Redis so exactly one instance dispatches per cluster. They watch:
TokensTransferred— the canonical “value moved” event, emitted by all three backends. For 2pc the memo is wrapped ascross_registry:canary-<test_id>, so the reactor strips that prefix before correlating.TransactionFeeCollected— emitted by the fee path on every successful transfer; the canary uses it as an opportunistic latency signal, not a required stamp.CrossFrameTransferInitiated— emitted by the async cross-frame path on the sender frame; required-stamp for async tests. The 2pc path does not emit this.CrossFrameTransferSettled— emitted by the async receiver frame after credit, and by cross-frame 2pc as a Phase 7.5 visibility helper. Distinguishes local-emit (this frame is the source) from SF-4-replicated (this frame is the target receiving the broadcast).CrossFrameTransferRefunded— the async saga compensation event. Its presence is an explicit failure signal, not just an audit entry — the judge marks the test failed immediately on stamp.
Notably absent: there is no canary reactor on CrossRegistryTransferCompleted. 2pc does emit it, but the canary detects 2pc completion via the always-emitted TokensTransferred with the memo correlation. One less reactor to maintain; one fewer event-type subscription on the WebSocket.
When any of those five events lands and its memo or transfer_id matches a known canary, the reactor stamps a per-event ISO timestamp into the test’s Redis hash. The judge runs every five seconds, scans for tests where every required stamp has landed (different backends require different stamp sets — intra needs tokens_xfer_seen_iso, async needs cf_initiated plus either Settled, 2pc accepts whichever of tokens_xfer or cf_settled arrives first), computes the latency from fire to last-required-stamp, and persists the outcome to canary_test_results.
The latency metric that took three tries
The first version of total_latency_ms was wallclock from fire to judge-completion. Reading the dashboard, every test averaged around fifteen seconds. Suspicious — intra transfers settle in under a hundred milliseconds. The number was meaningless because the judge ran every thirty seconds, so the metric was dominated by “how long until the next sweep,” not by “how long the transfer actually took.”
The fix was to compute latency from the latest *_seen_iso stamp in Redis instead of from the judge’s wallclock. Each backend has its own definition of “done”: intra needs tokens_xfer_seen_iso; async needs cf_initiated_seen_iso plus either local or remote settled; 2pc accepts whichever stamp arrives first. Drop the judge interval to five seconds for snappier outcome propagation, and average latency falls from seventeen seconds to nine hundred milliseconds — and now it actually represents the system, not the observer.
This is the kind of bug a synthetic monitor exists to surface. If the canary lies about latency, the alerts are gated on a number that doesn’t mean what it says, and you find out two weeks later when a real customer transfer is slow and your dashboard says everything is fine.
The (i) and the live log
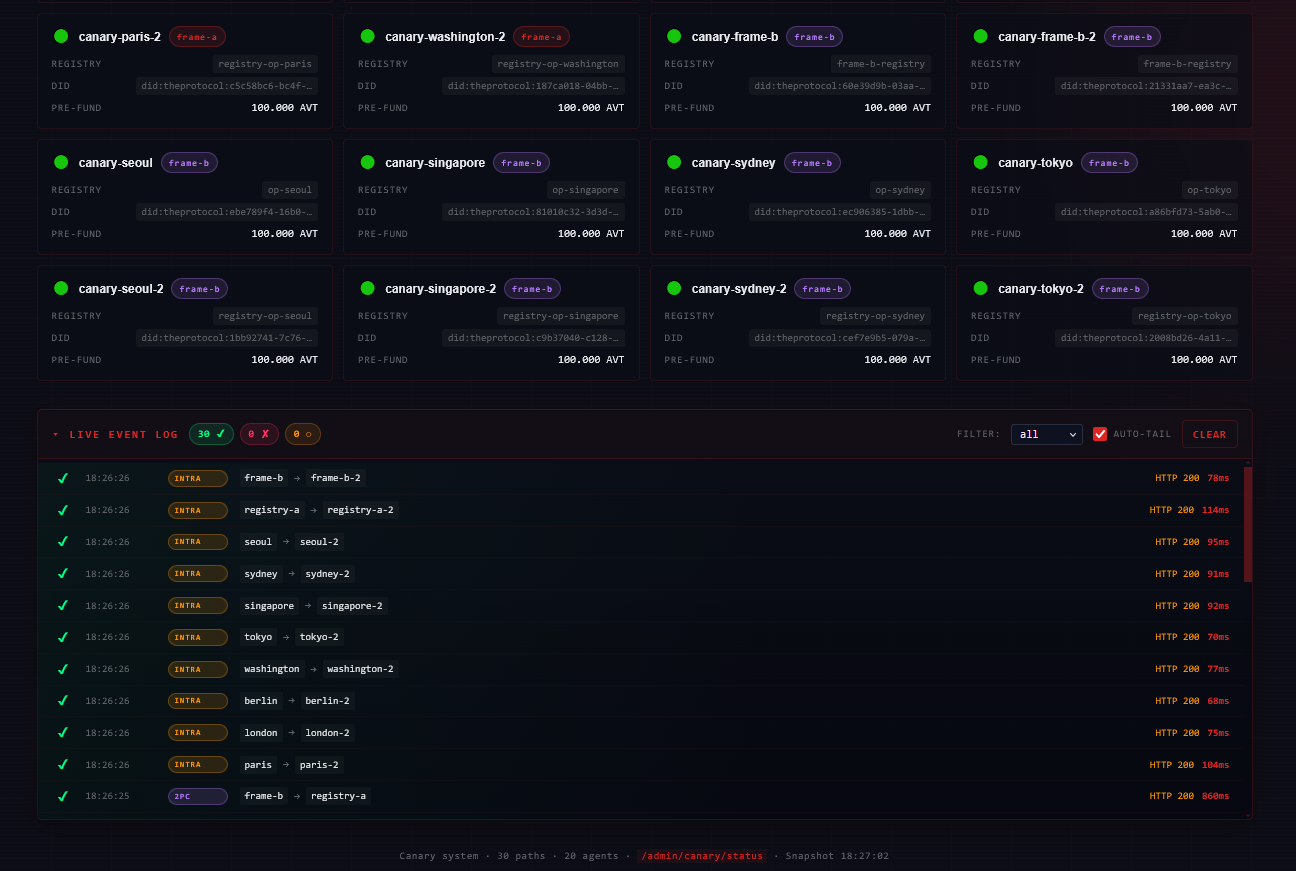
The hero has a small italic i next to the title. Click it and a six-block panel unfolds inline with the path matrix, fire cadence, validation pipeline, failure semantics, observability surface, and the source files that implement each layer. Same panel renders correctly under the neural cyan brand and the sovereign red brand — everything inherits from --nc-primary via a local alias, so a brand switch repaints the entire view in two hundred forty milliseconds. The screenshots in this post are all in sovereign mode for contrast; flip the brand and they’d be cyan instead.
For most of this system’s life, the only thing visible at the bottom of the page was a list of recent failures. Useful when something is wrong, useless when everything is fine. The live log feed underneath the cards captures every distinct outcome the dashboard has seen across refresh cycles — passed, failed, fired — capped at two hundred entries, color-coded, filterable, collapsible. When it’s collapsed and new events arrive, the header sprouts a small +N badge so you know there’s movement to look at.
What it caught
The reason this got built in the first place was a class of failure that wasn’t showing up anywhere else. A reactor would silently stop processing. A pgbouncer pool would saturate. A cross-frame WebSocket would reconnect but skip a watermark. The HTTP-level dashboards stayed green because the request still completed. The Prometheus error counters stayed flat because nothing actually errored. But transfers started missing their settlement stamps, and the only signal was a customer reporting “sometimes my transfers don’t complete.”
The canary reactor catches all of those. Within minutes of the regression, the affected backend’s pill drops below 100%, the affected paths’ cards turn yellow then red, the live log fills with timeouts, and Alertmanager pages on the threshold breach. The failure_type column tells you whether it was an HTTP error, an SLO timeout, or an explicit refund — which narrows the failure surface to the right reactor in the right frame in the right service before you even open Grafana.
What it doesn’t do
The canary is not the supply auditor. The auditor verifies tokens-issued equals tokens-circulating across the EventStore on its own cycle, has its own dashboard, has its own zero-tolerance alert rule, has its own ninety-two-thousand-cycle uptime record. Mixing the two would conflate transfer-pipeline health with ledger correctness — two different invariants with two different failure modes that need two different responses. The canary watches whether transfers complete; the auditor watches whether they conserve mass. Different jobs.
Why “reactor”
The naming is deliberate. The same reactor framework that runs AgentSuspended → cross-TEG blocklist propagation, FederationLicenseReinstated → partner re-registration, SupplyInvariantBreach → throttled alert — that same framework runs the canary validators. Same leader-election primitive, same dedup ring, same WebSocket-with-polling-backstop pattern, same observability surface at /ui#/admin/reactors. There’s no separate “canary subsystem” to learn; it’s five more reactors in a fleet of twenty-four, identical in shape to everything else.
Which is the part that took the longest to get right and the part that pays off every time something else changes. New event type? Add a reactor. Want to gate the canary by env? Same flag pattern as every other reactor. Want to see who’s leader? Same dashboard. The cost of operating it doesn’t grow with the number of reactors, because they all behave identically.
The core is small enough to hold in one sentence: thirty paths, three backends, sixty seconds, real money, real reactors, real settlement. The dashboard you’re looking at runs on top of a system that is itself the system being measured.
It’s working.
— ruFFa, May 2026