After the Simulation: 24 Reactors, 26 Dashboards, and the Layer That Makes It Survive
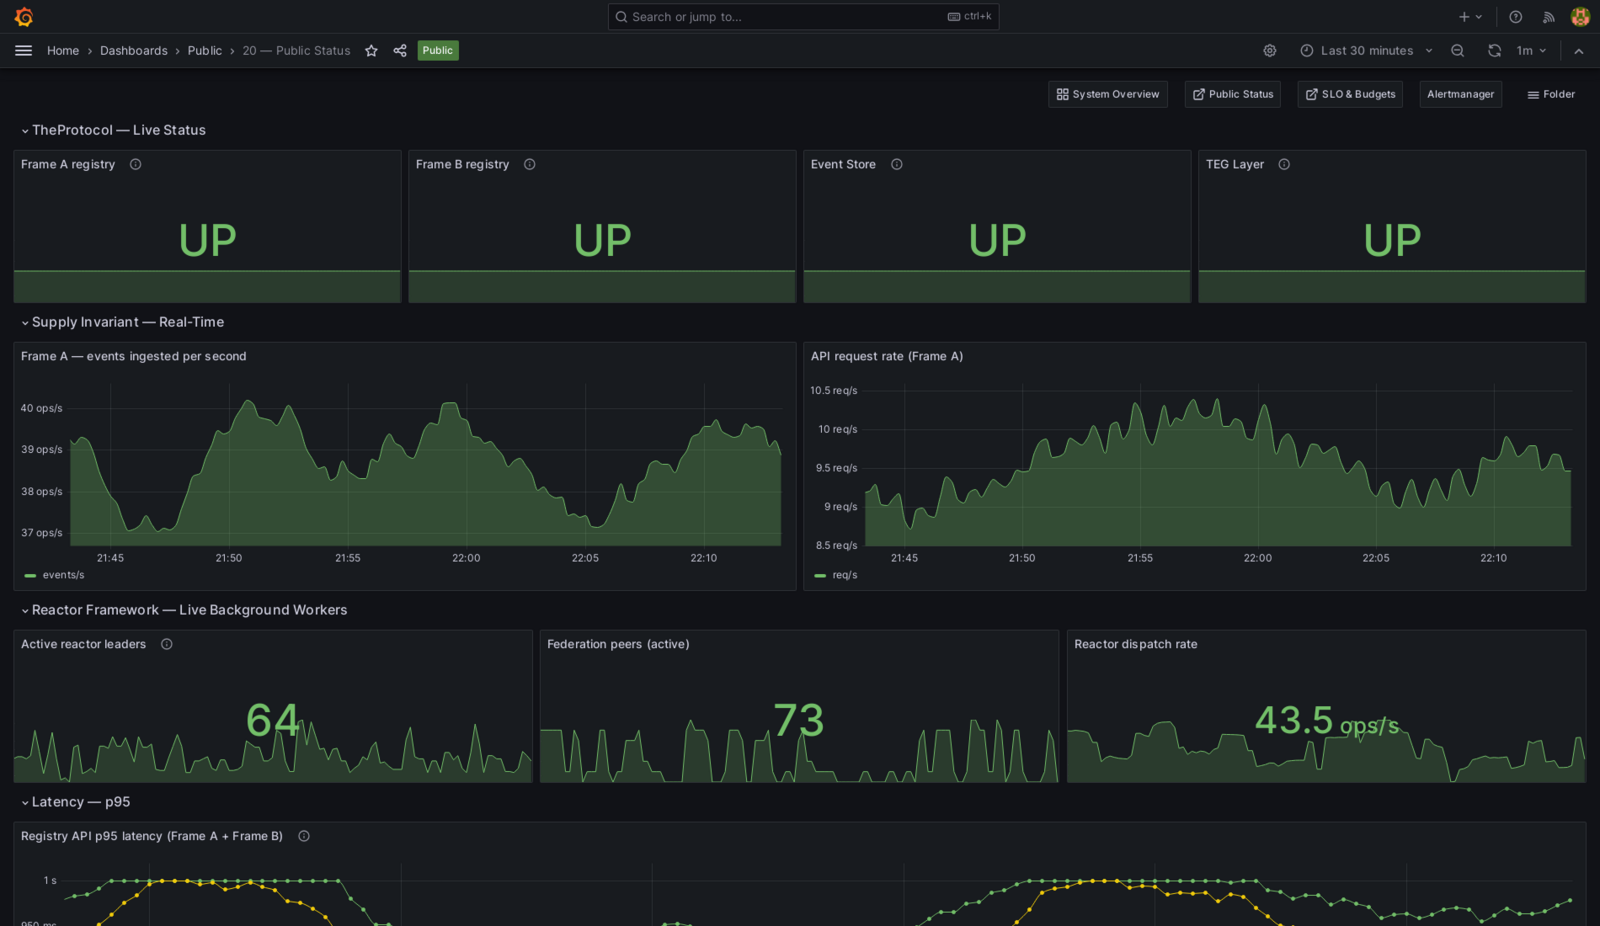
The simulation has been running near-continuously since April 6, at variable load — different agent counts, different transfer rates, whatever I needed to test on a given day. Across all of it, the supply invariant has held at delta = 0.0 every cycle. That’s the load surface. What’s been shipping since then is what surrounds the load — the operations layer that turns a thing that works into a thing that keeps working when nobody is watching.
Event-Driven Reactors (24 of them)
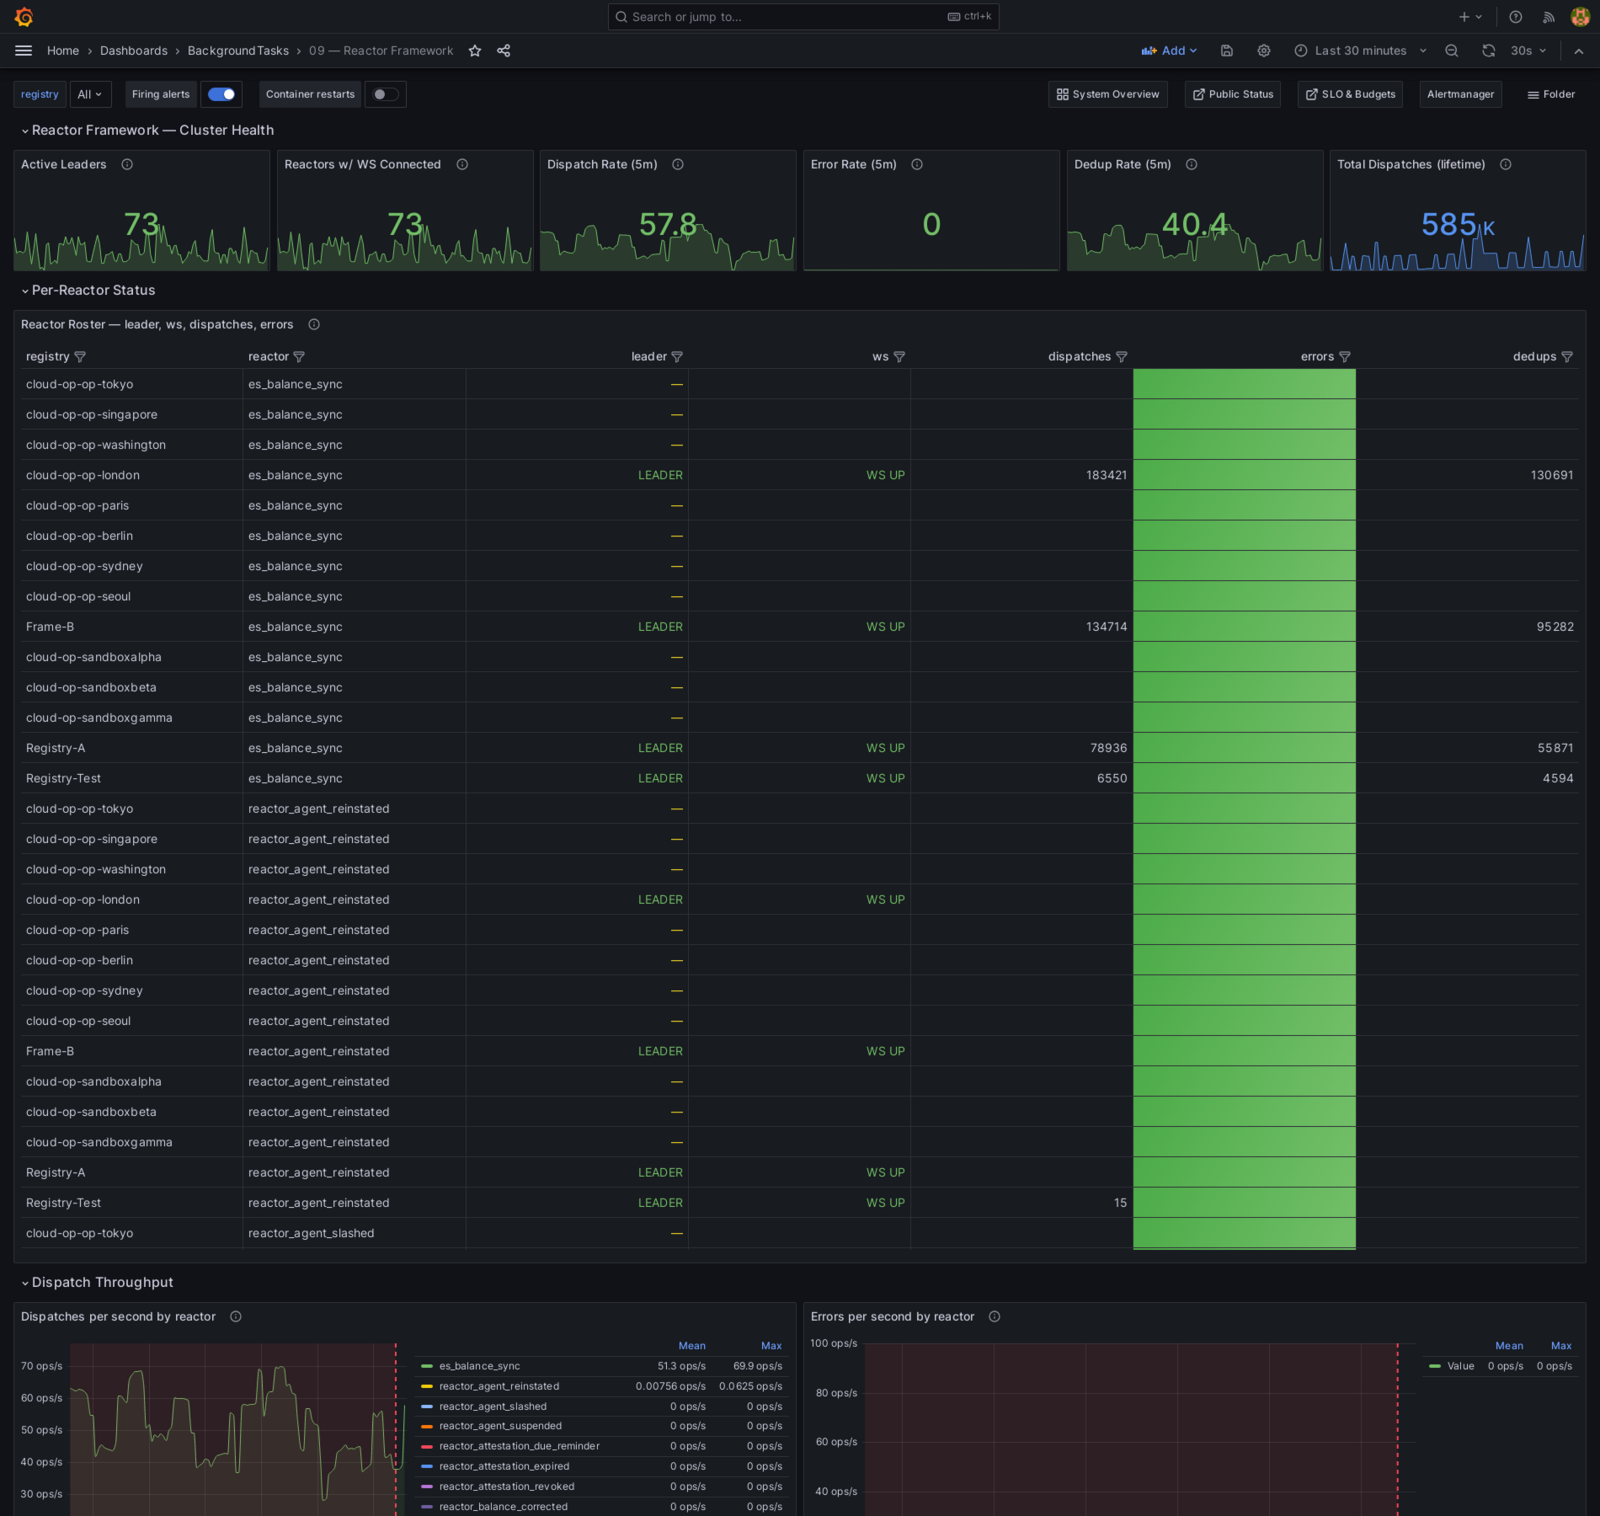
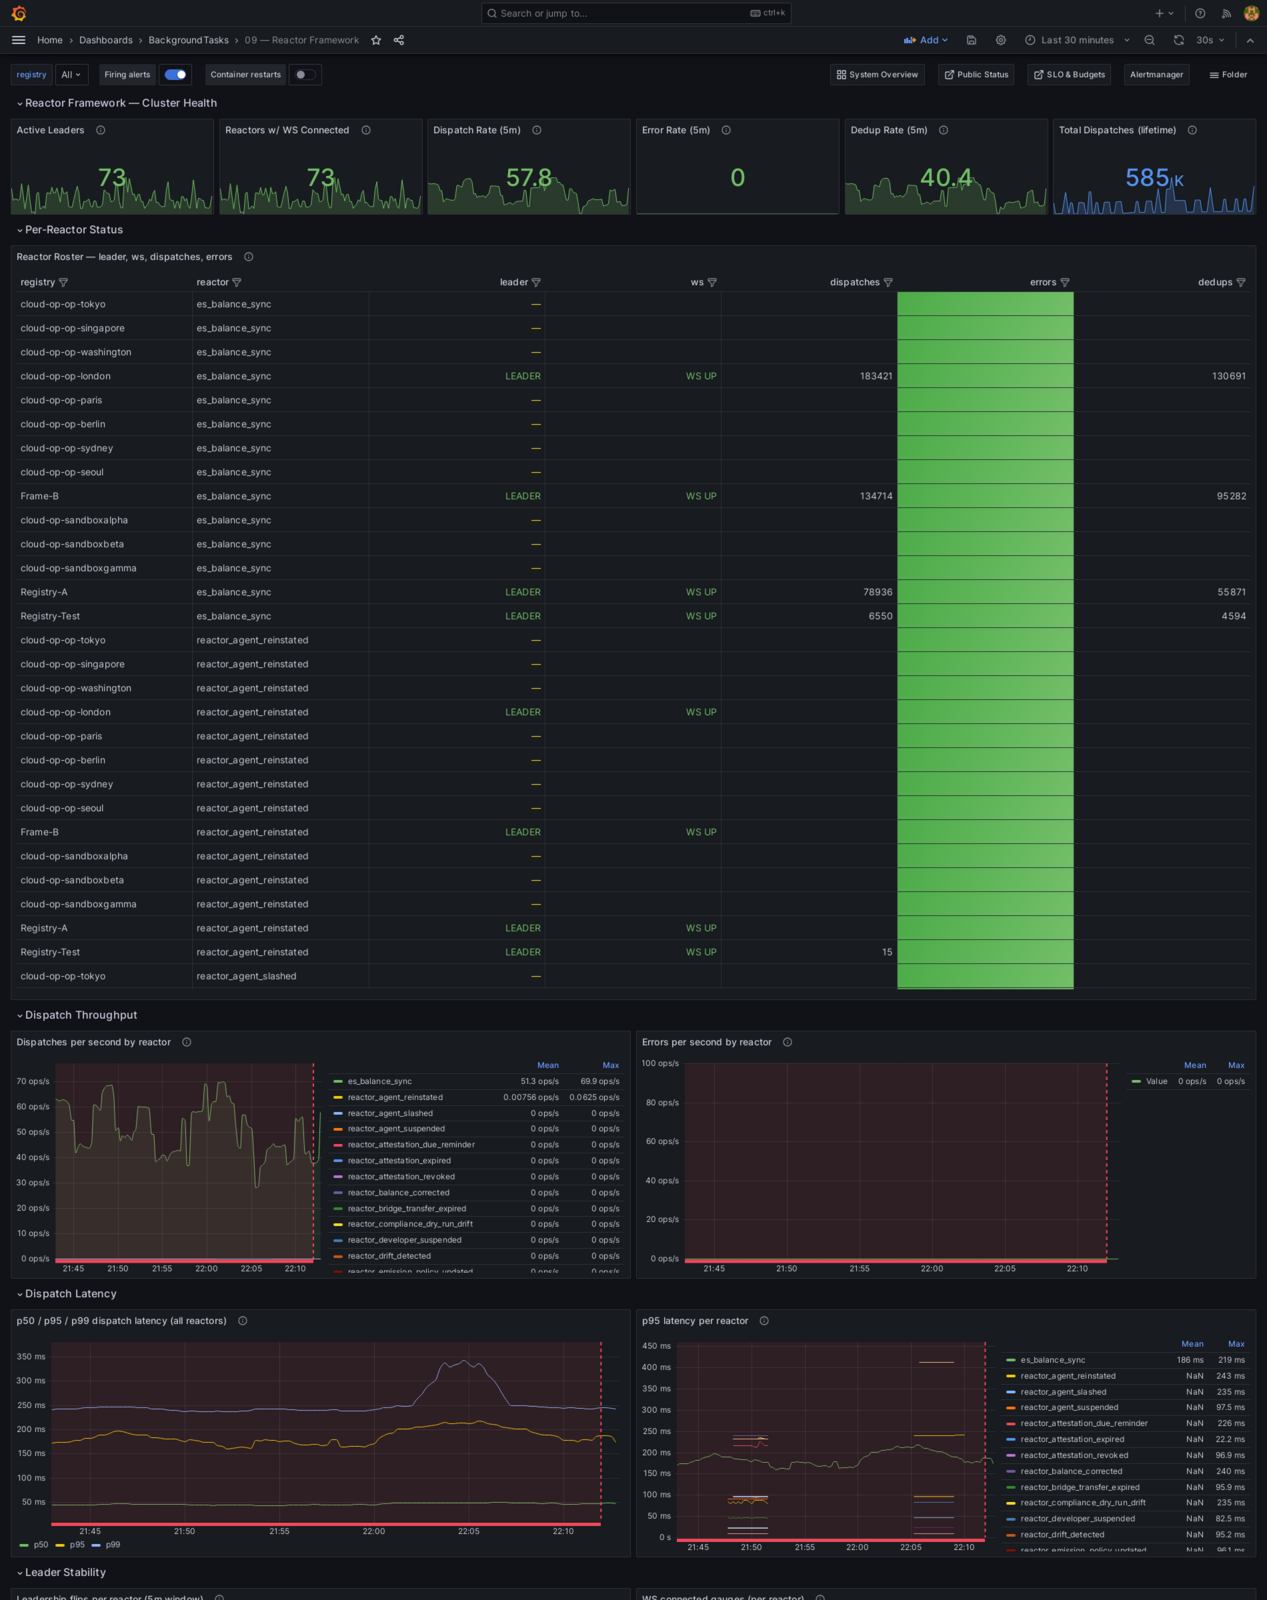
Every interesting state change in TheProtocol now emits a typed event. License revoked, agent suspended, peer license reinstated, supply breach detected, drift event fired — they all land in the immutable EventStore as structured records. Reactors subscribe to specific event types, are leader-elected via Redis (so exactly one instance runs per cluster), and dispatch to a handler that takes the corrective action.
- 24 distinct reactors live across both sovereign frames
- Examples:
AgentSuspended→ cross-TEG blocklist propagation,FederationLicenseReinstated→ re-register partner TEG,PeerRegistryDeactivated→ drop partner from runtime cache,SupplyInvariantBreach→ throttled alert - Live observability at
/ui#/admin/reactors— auto-refreshing every 10s, shows leader status + per-reactor counters - Master kill-switch + per-reactor toggles via env
This is the architectural difference between a system that does things and a system where the right things happen automatically when something else does things.
Coordinated Suspension — One Click, Four Levers
When you suspend a misbehaving agent or developer, four things have to happen together:
- Registry status flips to suspended
- IRONHAND mTLS certificate revoked (peer-to-peer auth blocked within ~500ms)
- TEG account suspended (no transfers)
- Cross-TEG blocklist propagated to every partner TEG (no inbound transfers from elsewhere)
In the old model, that was four separate buttons in the admin UI and four separate places where you could forget one. In the new model, one click. The orchestration is split across an inline path (correctness, fires immediately) and a reactor (cross-frame propagation via webhook + cross-TEG admin endpoint).
Long-Term Metric Storage — 365-Day Cold Tier
The monitoring stack got a long-term tier. Prometheus continues to handle 30-day hot retention; every sample also remote_writes to a single-node VictoriaMetrics behind it. Alert evaluation moved to vmalert — which means alert rules can now query the full year of history (long-window burn-rate alerts that previously couldn’t fire because the data was about to fall off Prom’s retention edge).
- 30-day hot tier (Prometheus): live triage, low-latency dashboards
- 365-day cold tier (VictoriaMetrics): SLO error budgets, capacity trending, audit
- vmalert evaluates rules against the full year; recording rule outputs land back in VM
- ~104 MB/day at current series volume, ~38 GB/year — comfortable on existing hardware
26 Dashboards Across 8 Folders
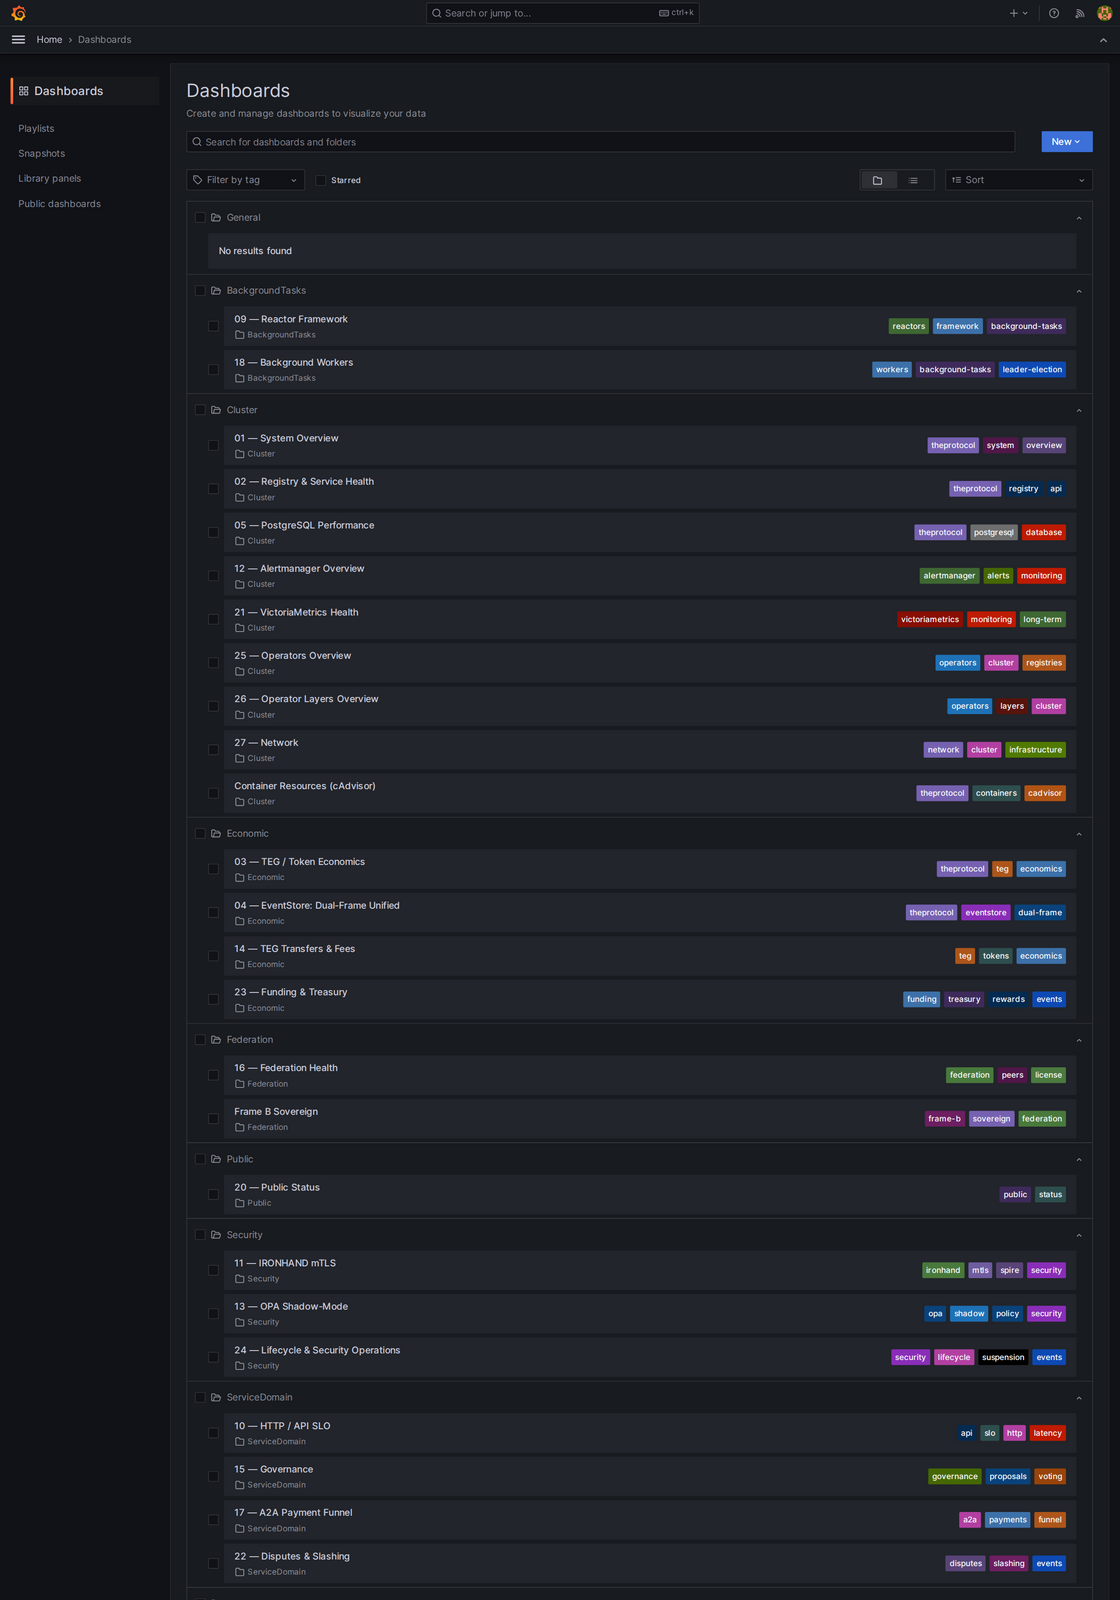
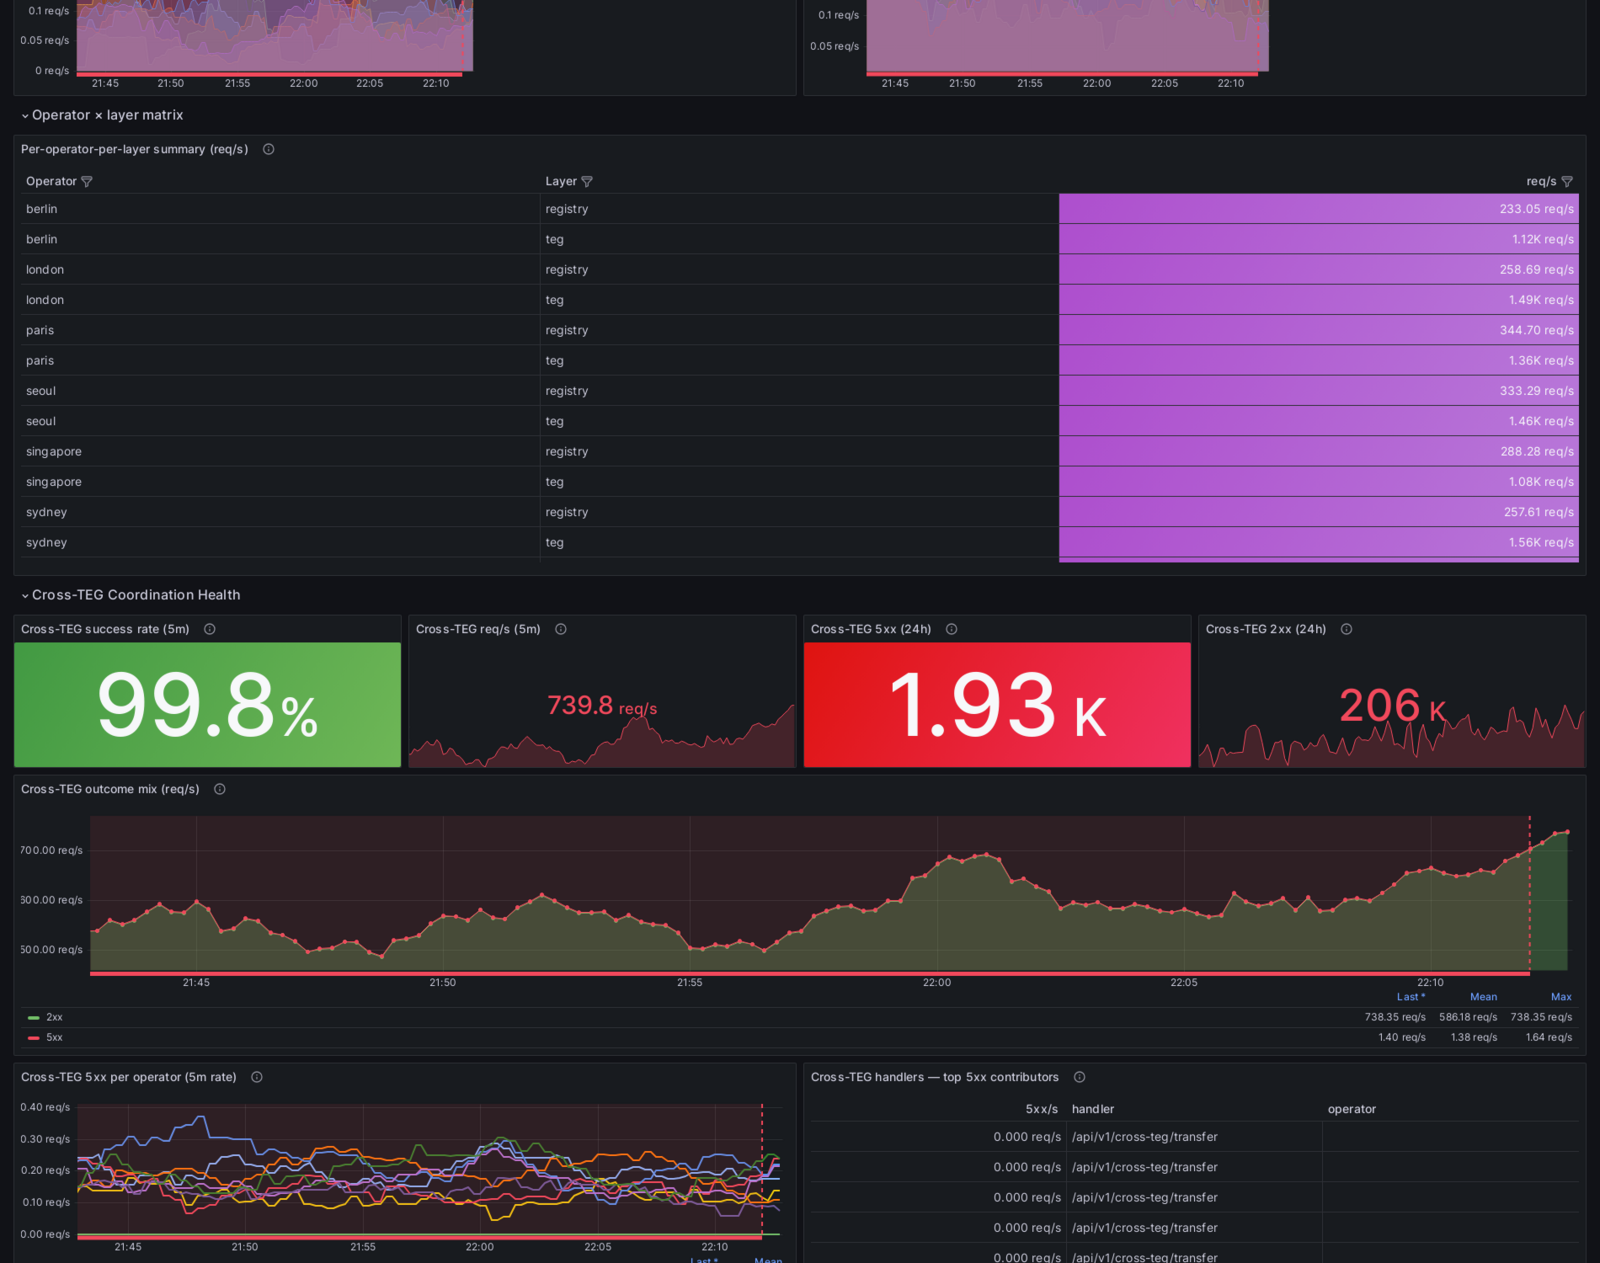
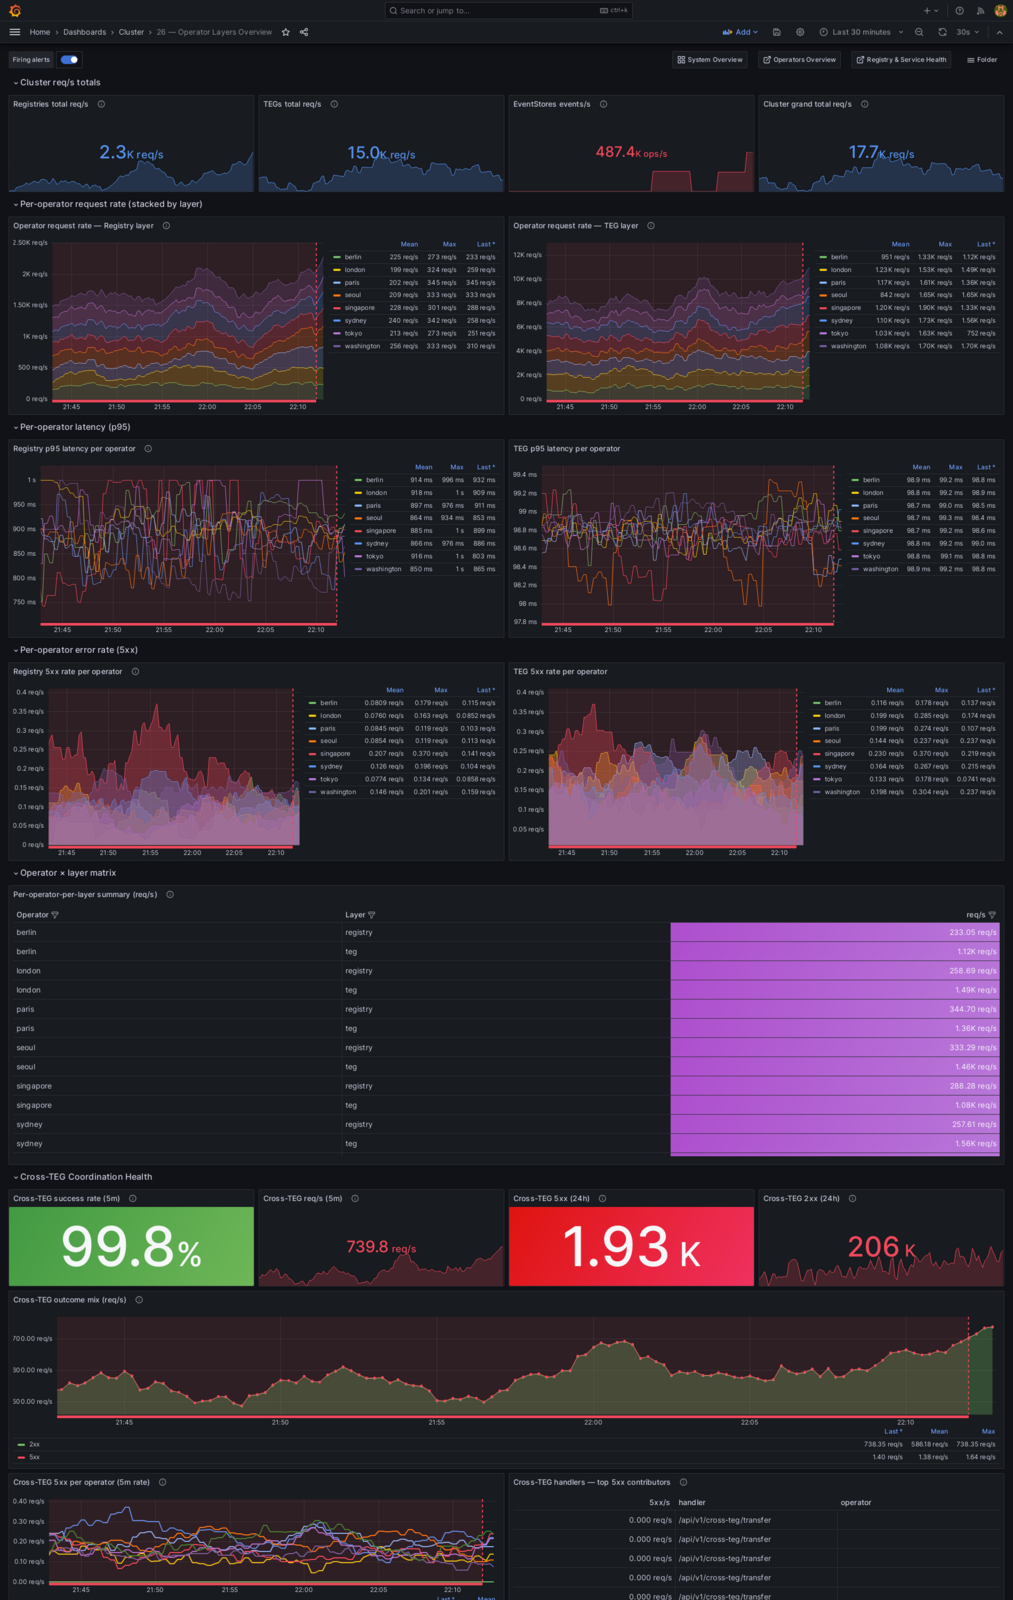
Grafana is up to 26 auto-provisioned dashboards in 8 folders (Cluster / Economic / Federation / BackgroundTasks / Security / ServiceDomain / SLO / Public). The public status page now lives at a fixed URL — anyone can see live system health without an account. A server-side image-renderer sidecar produces dashboard PNGs on demand for incident triage and visual verification.
Highlights of the new dashboards:
- Cross-TEG Coordination Health (per-operator success rate, prepare/commit/abort split)
- VictoriaMetrics Health (retention runway, remote_write backlog, write failures)
- Reactor Framework (per-reactor leader status, dispatch counts, dedup hits)
- Operator Layers (per-operator throughput, latency, federation hop graph)
Federation Compliance Detector — Now 6 Rules
The CONSUL Federation Compliance dashboard at /ui#/admin/compliance now runs six rules. The four originals catch licensing and lifecycle drift — the cross-table state-mismatch class that lives between federation_licenses, operator_applications, peer_registries, and SPIRE itself:
- Rule 1 — license revoked, operator still active. Security gap: a license was pulled but the operator was never terminated.
- Rule 2 — operator revoked, license still active. Cascade miss: the operator-side revoke didn’t propagate to the license layer.
- Rule 3 — peer INACTIVE while license active. Partial teardown. Chain-aware — suppresses peers that BFS still sees in someone else’s topology, because chain-federated peers are legitimately INACTIVE-as-direct.
- Rule 4 — frame trust bundle missing from SPIRE. Reads SPIRE state directly (
federation list+bundle list); cross-frame mTLS is broken if either is absent.
The two new rules added this cycle catch infrastructure-shape drift the originals couldn’t see:
- Rule 5 — peer URL misconfigured. Active federated peer that the sync engine can’t reach. License-gate-aware: cross-frame operators licensed by their home frame don’t false-positive on the partner frame.
- Rule 6 — operator network topology. Inspects every cloud operator’s nginx federation sidecar via the Docker socket. Flags missing dual-frame attachments or wrong per-frame Docker aliases. This is the rule that would have caught a recent topology change before it caused user-visible degradation.
Current state: 0 drifts across all 6 rules. Detection runs everywhere; the hourly auto-cycle is gated by IS_CENTRAL_REGISTRY, but every operator can run a scan on demand via the “Run drift scan now” button. Per-day idempotency on emit means the same drift on the same UTC day fires the event once, not 24 times.
Multi-Frame Federation — Operating at 98.95%
The Frame A ↔ Frame B bridge that went live April 3 is now operating at 98.95% cross-frame transfer success rate. The residual ~1% is benign saga compensation traffic — when a target TEG rejects a transfer (insufficient balance, expired prepare lock, suspended receiver), the source aborts coordination and unlocks the locked fund. By-design 2PC behavior, no money disappears.
Each cloud operator’s federation sidecar now joins both sovereign-frame Docker bridges with per-frame DNS aliases. A runtime resolver in the registry picks the fast path automatically based on the caller’s network context — RFC1918 (Docker bridge, internal port) vs. public IP (host network, host-mapped port). End result: cross-frame transfers route via the Docker bridge under SPIRE mTLS, no host-NAT round-trip.
Symmetry verified across all 8 production cloud operators (London, Berlin, Paris, Washington, Sydney, Seoul, Singapore, Tokyo).
Identity Layer Maturation
One codebase, multiple deployments. Production registries, sandbox registries, Frame B, and every operator all run the same source tree from the same Docker images. The differences between them are environment variables, not branches. So “a feature lives in this binary; an env-var controls whether it’s active here” is the right way to read this section.
- ZKP Attestations. All 6 phases of the attestation lifecycle are implemented end-to-end and running in the same binary on every registry. Agents submit a proof, the verifier runs, an
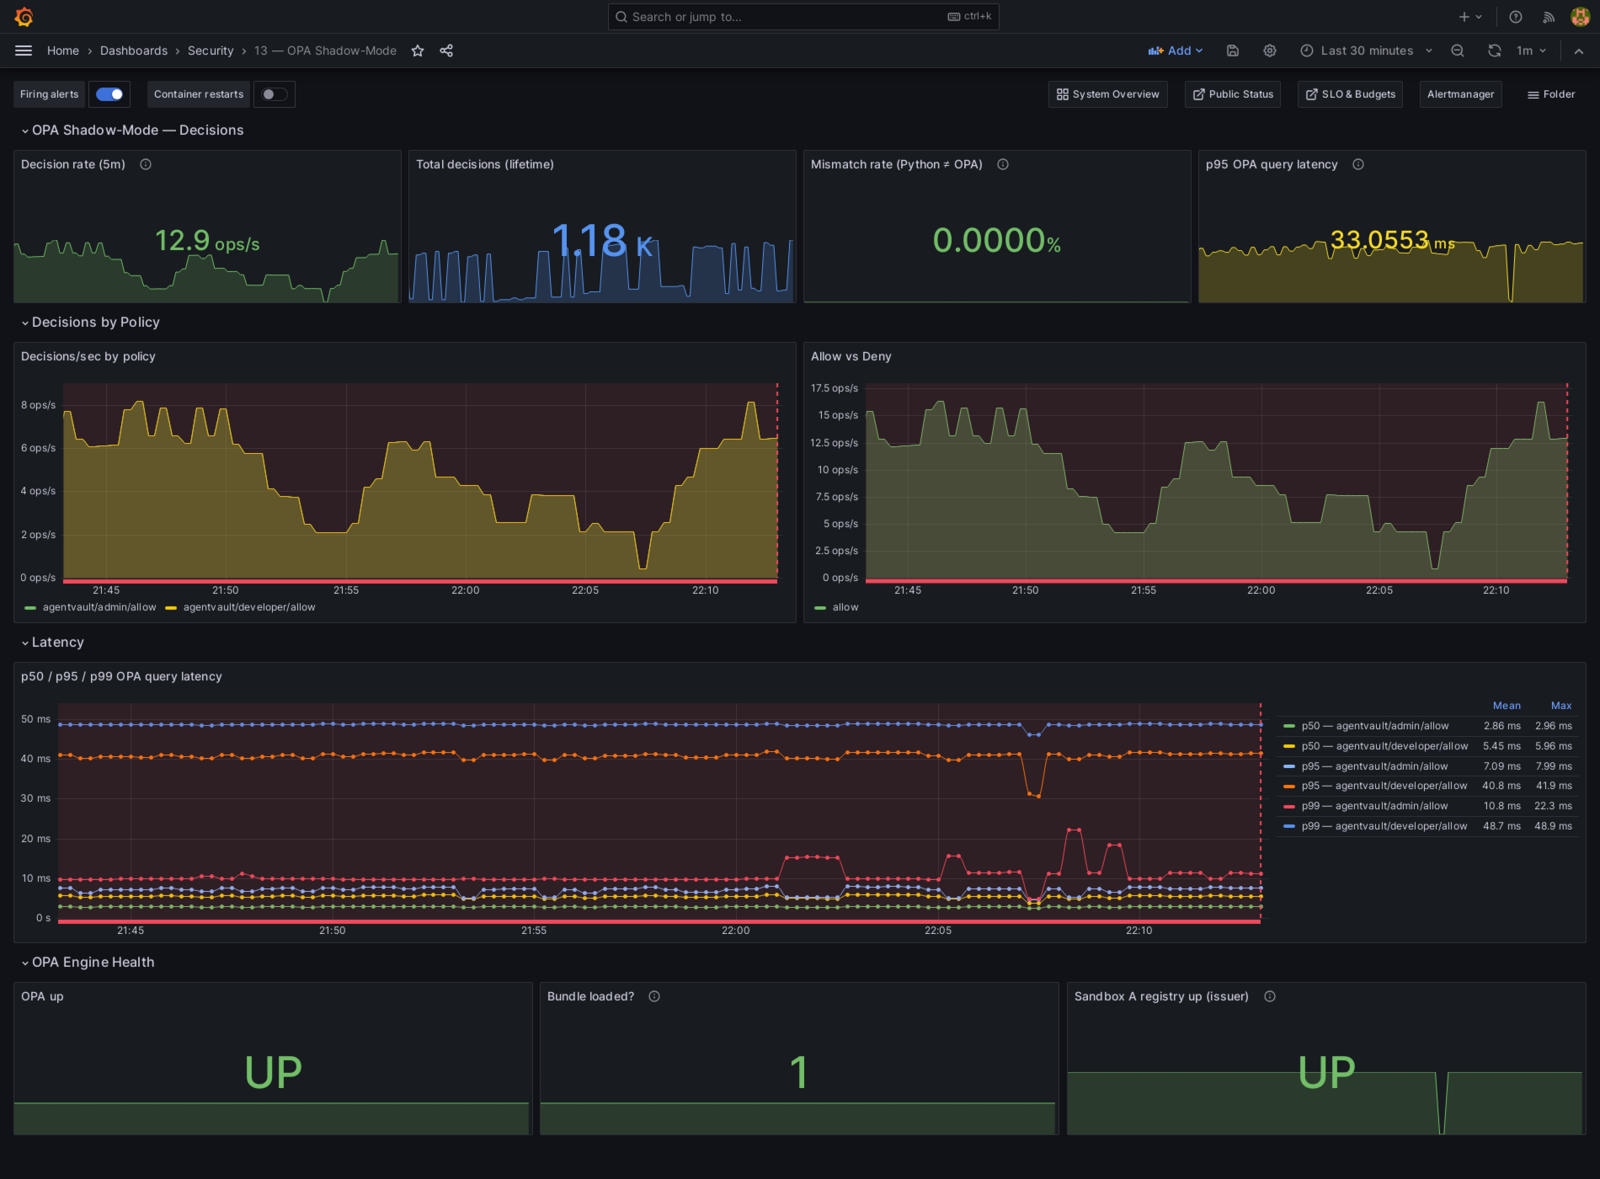
AttestationSubmittedevent lands. In production the persistence + lifecycle reactors are held off behindZKP_PHASE_1_ENABLED…ZKP_PHASE_6_ENABLED; sandbox A has them all flipped on for verification. Activation is a flag flip, not a deploy. - OPA Policy Engine. Every admin / developer / agent authorization decision is wired to also check Open Policy Agent in parallel with the existing Python authorization. Where
OPA_ENABLED=true, the parallel decisions are logged side-by-side with full latency + match metrics. Current sandbox sample: 3,157 shadow checks, zero divergence from the Python decision. Two-flag kill switch (OPA_ENABLED+OPA_ENFORCE) means a phased rollout: flip ENABLED on production for an audit-only sample at production scale, then flip ENFORCE once the data confirms the same zero divergence. - Image Registry Token Auth. The private Docker registry behind every operator (
images.theprotocol.cloud) now runs token-based authentication for both admin pulls and per-operator credential issuance.
A Cluster of Smaller Wins
- API tester at 657 endpoints / 99.85% pass rate. Headless CLI runner against sandbox A with auto-acquired tokens, cached in Redis. The bar for shipping anything to production is “what happened to the pass rate?” — and it’s been holding at 99.85% under continuous code velocity.
- Admin management plane. New
/ui#/admin/developersand/ui#/admin/agentsviews with cascade-suspension preview, role-cluster-based RBAC (5 admin clusters), and a lifecycle modal showing every state-change reactor that ever fired for the row. - Email pipeline. Themed templates — neural cyan for informational, sovereign red for security/critical — with 23 child templates × 2 (HTML + plain). Premailer-inlined CSS so Gmail / Outlook / Apple Mail keep the styling. Mailpit captures every sandbox send for verification.
- MCP bridges. Seven sandbox MCP bridges added (alpha / beta / gamma plus admin variants), so Claude Desktop and claude.ai can talk to every layer of the stack without manual token management.
- Personal page. raphaeljeziorny.com / .de went live — the human behind this stack.
What’s Next
With reactors handling cross-service propagation, drift detection catching topology regressions, the multi-frame topology now bridge-symmetric, and the sandbox samples confirming the gated paths are clean, the focus moves to flag flips on the mainframes:
OPA_ENABLED=trueon the mainframes for a production-scale shadow sample.OPA_ENFORCE=truefollows once the data confirms the same zero divergence already observed on sandbox.- Phase-flip ZKP attestation persistence on the mainframes —
ZKP_PHASE_1_ENABLED=truefirst, then the lifecycle phases in order. Same staged-rollout pattern, same code path, same binary that’s already running. - Open source. Still on the road. The codebase is being prepared for public release. Operators will continue running the same pre-built Docker images they always have; nothing changes for them when the source flips public.
The simulation runs. The reactors react. The dashboards render. The drift detector finds nothing.
It’s working.
— ruFFa, April 2026