Trust No Tool. Especially the Ones That Say "200 OK".
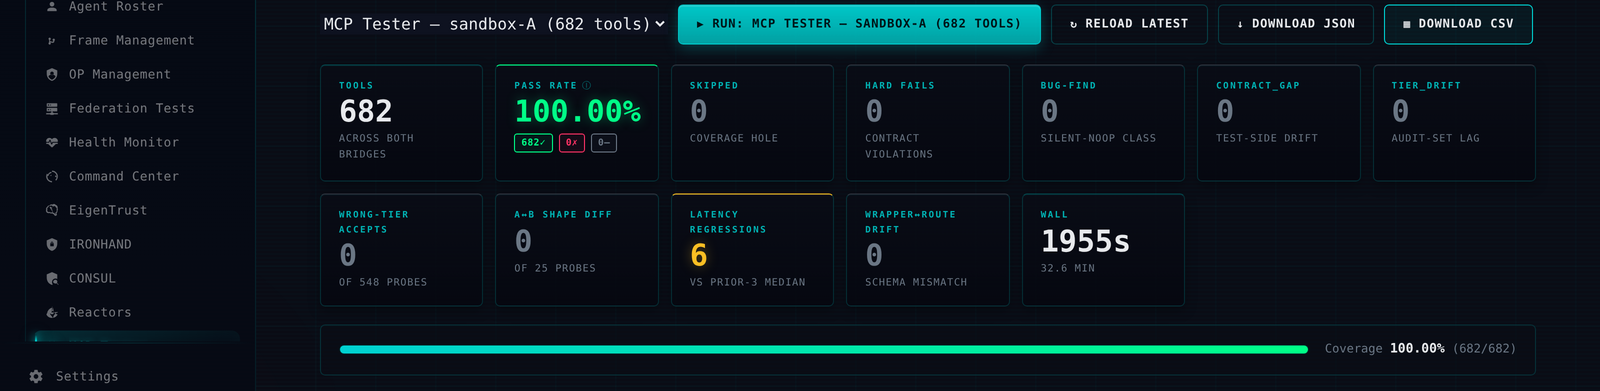
There are 682 tools wired into this platform that Claude can call directly — transfer tokens, stake, vote, file a dispute, mint an agent, provision a cloud operator, the works. Every single one of them is capable of returning 200 OK while quietly having done nothing at all. This is not a hypothetical failure mode. It is the natural resting state of software. The MCP Tester exists to be the one participant in this entire system that refuses to take yes for an answer.
The pitch, in one breath
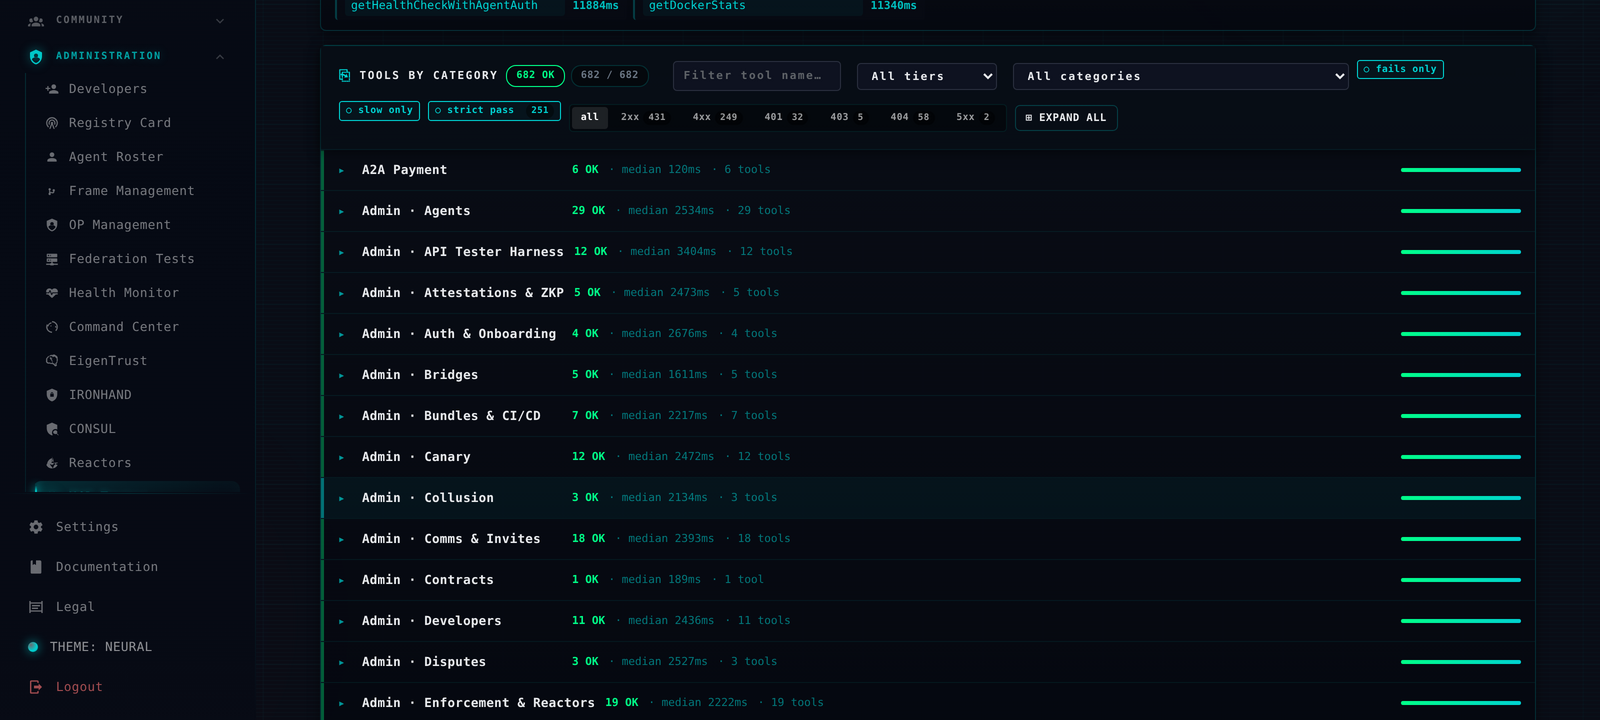
It sweeps all 682 tools across both JSON-RPC bridges — 380 public, 302 admin — and grades each one on twelve separate axes. It does not merely check that a call came back. It reads the EventStore afterward to confirm the thing the call claimed to do actually landed in the ledger. It checks the security audit log caught the call. It deliberately shows up at agent-only tools holding a developer token, purely to watch the door slam. It times every call against its own last ten runs so nothing rots from fifty milliseconds to eight hundred while I'm not looking. Then it writes the whole verdict to a dashboard, emits a fistful of Prometheus gauges, and — because the userbase is one and that one has ADHD — draws a little sparkline so I feel something.
The one rule: "200 OK" is a vibe, not a verdict
Here is the entire philosophy, free of charge. The only column that decides pass or fail is healthy. The HTTP status code is mood lighting. A tool can return a 400 and be perfectly healthy — that's a coverage probe poking an admin endpoint with empty arguments to confirm the wrapper is wired, or the wrong-tier matrix sending the wrong credential on purpose. A 401 in that column is the test passing. So the harness counts healthy, never status codes, and there's a toggle in the UI to surface every healthy-but-not-200 row on demand — because I trust myself slightly less than I trust the tools.
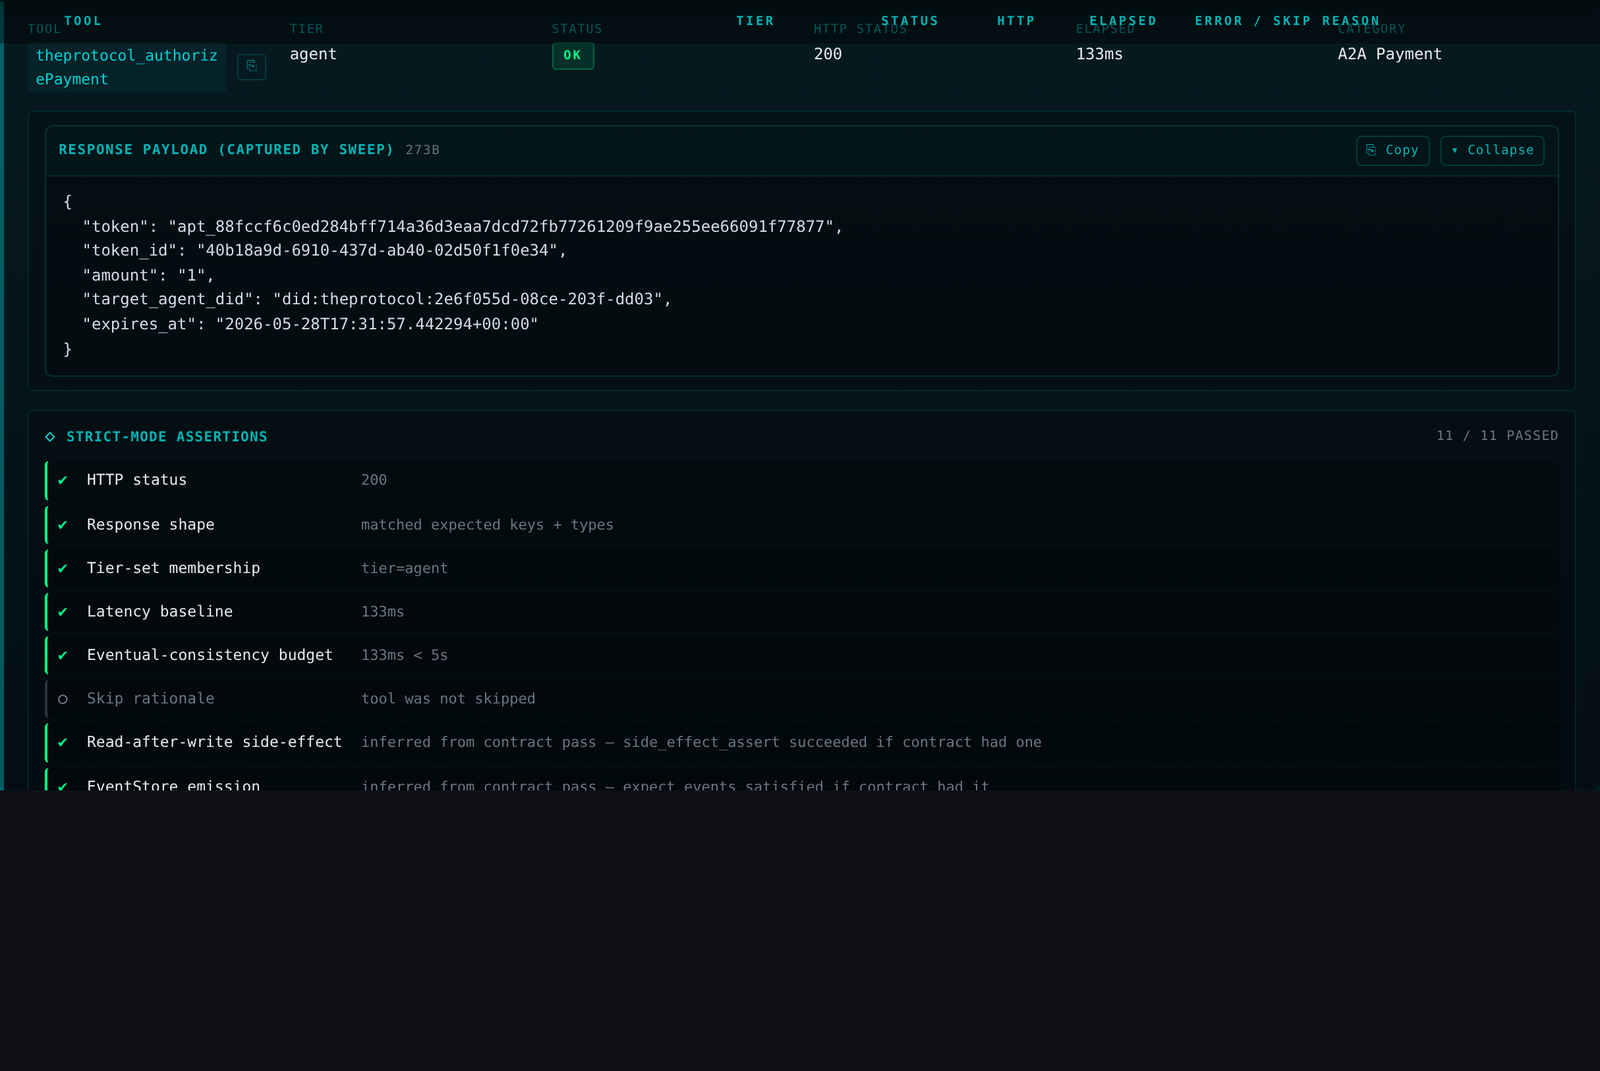
authorizePayment mid-interrogation: the exact payload the sweep captured, and the eleven assertions it had to clear before it was allowed to call itself healthy. The line with the open circle is "skip rationale: tool was not skipped," which is the harness's way of saying no notes.Twelve ways to catch a tool in a lie
Each one is a question the harness asks on every sweep. Fail any of the load-bearing ones and the tool is not healthy, no matter how cheerfully it returned:
- Status — did it succeed where success was the deal (or fail correctly where failure was)?
- Shape — are the keys it promised actually in the body, or did a field wander off?
- Types — was
balancea number yesterday and a string today? Caught cold. - Read-after-write — the 200 said it saved. The next read says otherwise. This is the silent-no-op, and it is the whole reason any of this exists.
- EventStore emission — a
transferTokensthat returns 200 without leaving aTokensTransferredin the ledger is a tool telling a story to itself. - Audit row — did the call land in the security audit log, or did it sneak past the pipe?
- Tier membership — is the tool wired to the auth tier it claims, in the actual dispatch tables?
- Wrong-tier rejection — send the wrong credential; demand a 401/403. An accepted one is a privilege-escalation regression, and the harness throws ~548 of these probes per run just to be unpleasant.
- Latency baseline — slower than 2× its own recent median? Flagged. Advisory, but I get the nag.
- Wrapper/route drift — the tool's advertised input schema versus what the underlying route actually accepts. They should agree. Sometimes they don't.
- Cross-frame parity — the same public read on two sovereign frames should return the same shape. Different answers fine; different skeletons, not fine.
- Eventual-consistency budget — for the things that propagate (federation sync, pull-sync, an eigentrust epoch), did they actually catch up inside the time budget?
Destructive tools don't get a pass on coverage either. The harness creates a throwaway agent, mints it a token, has it delete itself, and confirms it's gone — a real 200 on a real delete that never once touches anything load-bearing. The deletions are all consenting and disposable.
It runs on a leash
One non-negotiable: this thing is sandbox-only, enforced in three independent places that would all have to fail at once for it to ever breathe on production. The backend refuses with a 400 if you so much as point it at a real registry. The runner hardcodes the sandbox target regardless of where it's invoked. The frontend throws up a red refusal banner. Belt, suspenders, and a second pair of suspenders — because the lifecycles are gleefully destructive by design (they spawn webhooks, bundles, payments, organizations, and throwaway agents, then clean up after themselves), which is precisely what you want in a sandbox and precisely what would get me uninvited from my own platform anywhere else.

The obligatory solo-founder paragraph (kept short, as promised)
I built this alone, the way I build everything here. So far the only entity that has ever run the MCP Tester is me, and the only tools it has ever caught lying were also mine. I'm aware this is a closed loop: one person writes the tools, one harness catches the tools, the same person fixes them, repeat. But the bugs were real, the green is real, and the alternative — handing 682 tools to an actual language model on a fingers-crossed and a vibe — is how you end up as a chapter in the cautionary-tales genre. I'd rather be paranoid and boring.
If you want the exhaustive, joke-free version — every axis, every contract field, the full operating manual — the Oracle has it at Chapter 12. This was the fun version.
— ruFFa, sole creator of the antithesis to Skynet, and, for the time being, its sole user. The machines are being watched. By one guy. With a sparkline.